Data Solutions Services

We provide comprehensive data engineering, analytics, and visualization services for socio-economic development projects.

A laptop displaying a dashboard with various graphs, charts, and numeric data. The screen is partially visible, showcasing sections with line graphs, financial figures, and small images. The background is blurred with a prominent red light creating a warm ambiance.
A 3D illustration featuring a web browser interface with the word SEO, various charts and graphs, a pie chart, and a rocket launching from the top of the window. The background is dark with scattered white dots, resembling a starry sky.
Engineering Excellence

Our engineering services focus on building robust data pipelines for effective data management and analysis.

Analytical Insights

Unlock valuable insights through our advanced analytics services tailored for socio-economic development initiatives.

woman wearing yellow long-sleeved dress under white clouds and blue sky during daytime

Their data visualization transformed our approach to socio-economic development, making insights clearer and actionable.

John Doe

Lines of computer code are displayed on a dark background, featuring SQL and JavaScript syntax with colorful syntax highlighting. The code includes a SQL query and JavaScript function handling datasets.

Exceptional analytics services that significantly improved our data-driven decision-making for socio-economic projects.

Jane Smith

A smartphone displays analytics data with graphs showing views, downloads, and likes. It is resting vertically on a white dock next to a small potted succulent plant. In the background, a large computer monitor is partially visible, along with a closed laptop and a white wireless earbud case.
★★★★★
★★★★★
The image depicts an architectural or engineering workspace featuring technical drawings with precise measurements and annotations. Several drafting tools, including a pen, pencil, protractor, and triangular scale, are placed on top of the drawings. A rolled-up sheet of paper and a metallic rectangular case are also visible, adding to the professional and organized setting.

Gallery

Explore our projects showcasing data-driven socio-economic development solutions.

Two laptops display dark-themed screens; one shows analytical graphs and statistics, including conversion rates, store sessions, and geographic distribution. The other screen displays a grid of web application icons. The scene is dimly lit, emphasizing the glow from the screens and the softly illuminated keyboards.
A person is working on a laptop at a table, focusing on a software interface displayed on the screen. The interface appears technical or related to programming and data flow. The setting seems to be a modern indoor office or study area with a window in the background.
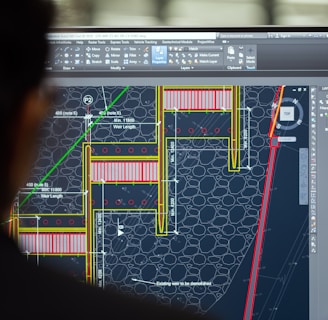
An individual is in front of a computer monitor displaying a detailed architectural or engineering design, possibly a floor plan or structural layout with measurements and annotations. The design is composed of various lines in colors like yellow, red, and green against a dark background, and the interface resembles a CAD software.
A laptop on a wooden desk displays a web application interface featuring graphs and statistics. Beside it, a large monitor shows a webpage promoting an all-in-one meeting app. A cup with a recognizable green and white logo sits on the desk.
A digital dashboard displays metrics related to web performance. Graphs show detailed statistics such as total clicks, total impressions, average click-through rate (CTR), and average position over time. The chart utilizes various colors to distinguish different data sets, and the interface features tabs labeled 'QUERIES', 'PAGES', 'COUNTRIES', 'DEVICES', and 'SEARCH APPEARANCE'.